 Scoped SEO
 Add to Chrome
Speed
Core Web Vitals and a load timeline measured in your browser on the page you are viewing, with the limits of every number shown.

Read this first
Speed measures the page in your browser, on your connection, in the window you have open. It is not a lab test and not real-user data, so it can differ from Lighthouse or PageSpeed Insights. The card says what window it measured in, such as "Measured in a desktop window (1920x919)", and mobile is not simulated. Run PageSpeed Insights alongside it when you want lab and field data. The footer has a button to open it and another to copy the page URL.
Performance score
The ring is a Scoped SEO indicator, labelled as such on the card. It combines five components:
| Component | Weight | Full credit at | No credit at |
|---|---|---|---|
| Load time | 25 | 1800 ms | 6000 ms |
| TTFB | 15 | 600 ms | 2400 ms |
| LCP | 30 | 2500 ms | 6000 ms |
| CLS | 15 | 0.1 | 0.5 |
| Requests | 15 | 50 | 150 |
A component that couldn't be measured is left out and the rest are re-weighted, and the card tells you which. With fewer than three components, or without load time or LCP, the score reads Not scored.
Core Web Vitals
- LCP (Largest Contentful Paint), with the LCP element named and a Locate button. A phase breakdown appears when the browser reports image timing.
- INP (Interaction to Next Paint) needs real clicks, taps or key presses. If none were seen, the card reads Not measured. Interact with the page, then press Refresh readings.
- CLS (Cumulative Layout Shift), reported for the largest shift window.
- TTFB (Time to First Byte) is in the timeline.
Timeline and resources

DNS lookup, TCP connection, TTFB, First Contentful Paint, LCP, DOM Interactive, DOM Content Loaded, DOM Complete and Page Load, each labelled Good, OK or Slow.
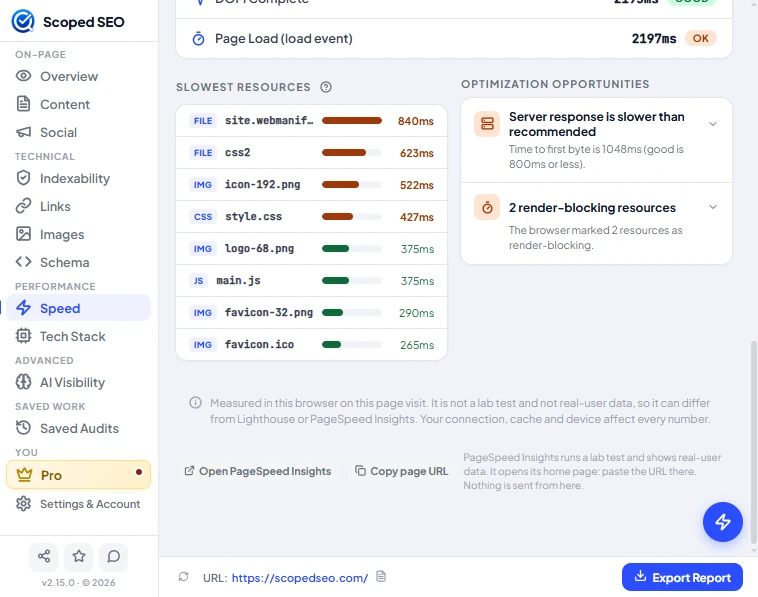
The slowest resources are listed with their type and time. Optimization opportunities expand to four parts: why it matters, the evidence, what to do, and the limits of the check. Diagnostics cover slow TTFB, an LCP image that is lazy-loaded or found late, large images (200 kB or more), render-blocking resources, JavaScript size, many or slow requests, failed requests, fonts, third parties and layout shifts.
Saved audits and reports
A saved audit stores the scan with its values, source, timestamp, window and caveats. Reopening never re-measures. Audits saved before version 2.13 keep the older formula and say so.